Seven months after the Fed started its aggressive tightening, the yield curve inverted in October 2022. Over the last five decades, every inversion was succeeded by a recession with the lag varying from 6 months (1973) to 23 months (2006).
An earlier inversion in 1966, however, did not lead to an immediate economic downturn. A recession only occurred 41 months later, following subsequent inversions in 1969.
Will the latest yield curve inversion prove to be another false alarm like 1966? There are certainly similarities in the broad macroeconomic conditions. After both inversions, the labor market exhibited remarkable resilience and strength.
If the GDPNow estimate of 5.6% for Q3's real GDP growth turns out to be correct, the output is on track to follow 1966's trajectory suppressing all other cycles.
Buoyed by the robust economic backdrop, investors are optimistic. Stocks surged by nearly 20% in the first year following both inversions.
But there is a critical difference. In 1966, the Fed was not on a mission to combat inflation. Interest rates were swiftly cut two months after the 1966 inversion. Monetary policy remained moderately accommodative throughout the late 1960s, which likely contributed to averting a recession.
The soft landing, however, came at a cost. Core PCE inflation was 2.6% at the time of the 1966 inversion and steadily rose to 4.8% in 1969. During the 1980 cycle and in the aftermath of more than a decade's loose (1966), ultra-loose (1973) and inconsistent (1978) monetary policy, the Fed had to hold rates at an unprecedented level of ~5% above the Taylor Rule for two years to bring inflation from 9.8% down to 3.7%.
Lessons from the Great Inflation of the 1970s are learned. As soon as the Fed was convinced that inflation was not transitory, it took the federal funds rate from 11.5% below the Taylor Rule in April 2022 to close to parity within one year, and made clear its intention to hold rates high for longer.
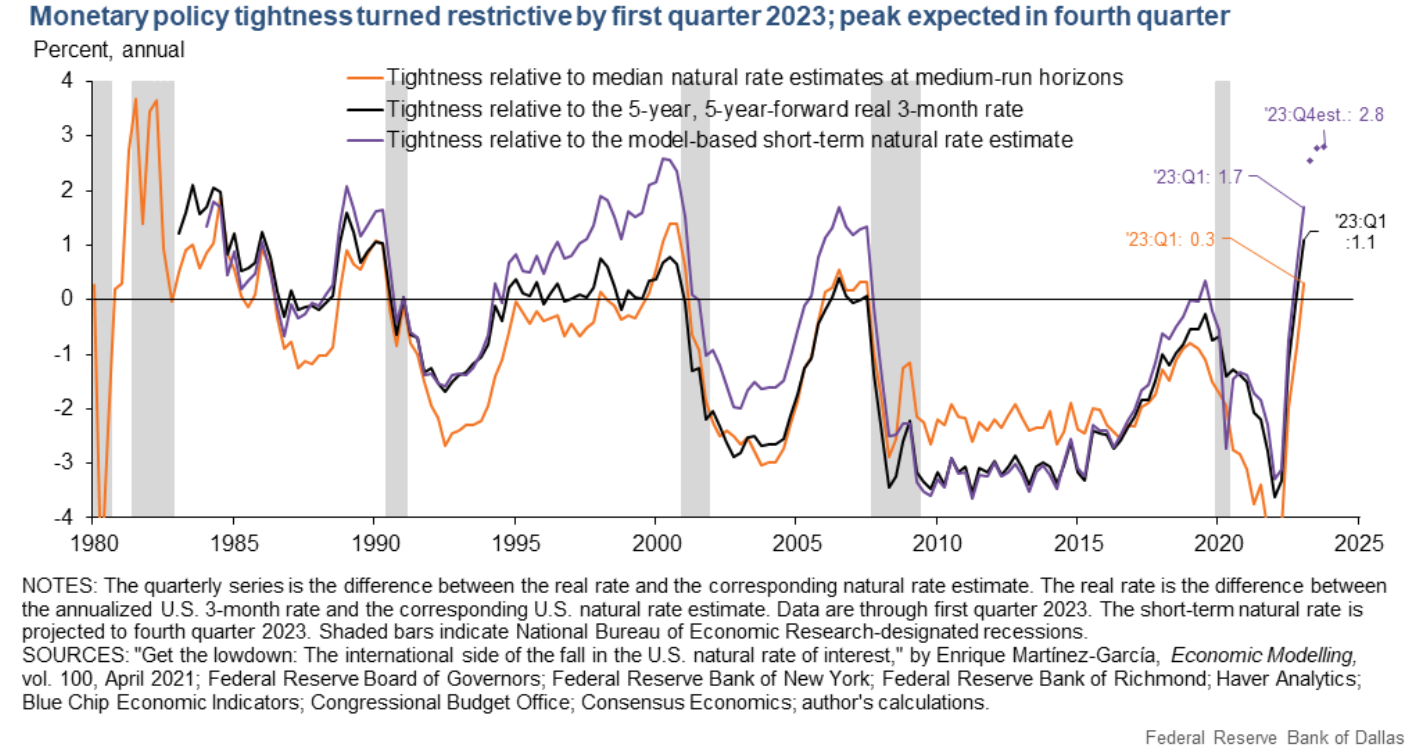
All predictive components in the most powerful leading indicator have now flipped. The 10-year and 2-year spread inverted in July 2022. The 10-year and 3-month spread inverted in October 2022. The near term forward spread (NTFS) inverted in November 2022. The real rate gap, a dominant factor in NTFS, turned positive in 2023 Q1 for the first time since 2019 and is expected to suppress its 1999 high in 2023 Q4.
If the Fed is able to achieve its 2% inflation goal and simultaneously pull a soft landing, it marks the first time in history it successfully striking the delicate balance between being not restrictive enough and being too restrictive. It's possible that the majority of the Fed's tightening effect in this cycle has already happened and is sufficient to bring inflation down. Given the current magnitudes of conventional yield spread measures, investors should be more fearful of a hawkish Fed.